
Last updated: July 12, 2026
A SQL Server deadlock happens when two or more sessions each hold a lock the other needs, so neither can move forward. SQL Server’s lock monitor breaks the tie by choosing one session as the deadlock victim, rolling back its transaction, and returning error 1205 to that session’s caller. If your users see intermittent transaction failures, or your logs show error 1205, deadlocks are the cause.
This guide covers how deadlocks form, how to capture and read deadlock graphs, the five root-cause categories, the most effective fixes ranked by impact, long-term prevention and monitoring, and how AI SQL Tuner Studio automates the whole diagnosis in minutes with its Fix Deadlocks goal.
Table of Contents
What Is a SQL Server Deadlock?
A deadlock occurs when two or more sessions each hold a lock that the other needs to proceed. Because neither session releases its lock until it acquires the one it is waiting for, both are stuck indefinitely. SQL Server’s lock monitor detects this circular dependency every few seconds and resolves it by selecting one session as the deadlock victim, rolling back its transaction, and returning error 1205 to that session’s caller.
Deadlocks are different from ordinary blocking. In blocking, Session A waits for Session B to release a lock. Session B eventually releases its lock and the wait ends on its own. In a deadlock, Session A waits for Session B while Session B simultaneously waits for Session A, so the wait never ends without intervention.
SQL Server chooses the victim based on the cost of rolling back each transaction; by default the session with the least transaction log activity is chosen. You can influence this with SET DEADLOCK_PRIORITY LOW in sessions that are acceptable victims, or SET DEADLOCK_PRIORITY HIGH in sessions that should be protected.
How to Detect SQL Server Deadlocks
SQL Server records deadlock details as XML documents called deadlock graphs. You can capture them with Extended Events, which is the recommended approach on modern versions of SQL Server. Trace Flag 1222, an older method, writes deadlock information to the SQL Server error log and is still handy for quick diagnostics on servers where you cannot create Extended Events sessions.
The system_health Extended Events Session
SQL Server runs a built-in Extended Events session called system_health at all times. It captures deadlock graphs automatically and stores them in an in-memory ring buffer and in XEL files on disk. You can query recent deadlocks from the ring buffer with:
SELECT xdr.value('@timestamp', 'datetime2') AS DeadlockTime, xdr.query('.') AS DeadlockGraphFROM ( SELECT CAST(target_data AS XML) AS TargetData FROM sys.dm_xe_session_targets t JOIN sys.dm_xe_sessions s ON s.address = t.event_session_address WHERE s.name = 'system_health' AND t.target_name = 'ring_buffer') AS DataCROSS APPLY TargetData.nodes('//RingBufferTarget/event[@name="xml_deadlock_report"]') AS XEventData(xdr)ORDER BY DeadlockTime DESC;
The ring buffer holds a limited number of events and is cleared on restart. For a production system with recurring deadlocks, consider creating a dedicated session that writes to a file target for persistent storage.
Creating a Dedicated Deadlock Capture Session
The following Extended Events session captures all deadlock graphs to a file target on disk. Adjust the file path to a location with sufficient free space:
CREATE EVENT SESSION [DeadlockCapture] ON SERVERADD EVENT sqlserver.xml_deadlock_report( ACTION( sqlserver.client_app_name, sqlserver.database_name, sqlserver.session_id, sqlserver.sql_text ))ADD TARGET package0.event_file( SET filename = N'C:\DeadlockLogs\Deadlocks.xel', max_file_size = (50), max_rollover_files = (10))WITH ( STARTUP_STATE = ON);GOALTER EVENT SESSION [DeadlockCapture] ON SERVER STATE = START;
Set STARTUP_STATE = ON so the session resumes automatically after a restart. Review captured files in SSMS via File > Open > File, which renders deadlock graphs visually.
Reading the Deadlock Graph
A deadlock graph shows each involved session as an oval and each contested resource as a rectangle. Arrows between ovals and rectangles represent lock requests and grants. The session marked as the deadlock victim has an X through it.
To diagnose a deadlock from its graph:
- Identify the two sessions and the SQL statement each was executing at the time of the deadlock.
- Note the object ID and index ID of each contested resource shown in the graph.
- Map those IDs to table and index names using
sys.partitionsandsys.indexes. - Compare the lock types each session held versus what each was waiting for to classify the root cause.
Use this script to map object and index IDs from a deadlock graph to their names:
SELECT OBJECT_SCHEMA_NAME(p.object_id) AS SchemaName, OBJECT_NAME(p.object_id) AS TableName, i.name AS IndexName, p.object_id, p.index_idFROM sys.partitions pLEFT JOIN sys.indexes i ON p.object_id = i.object_id AND p.index_id = i.index_idWHERE p.object_id = <object_id_from_graph>;
The 5 Root Cause Categories
Most SQL Server deadlocks fall into one of five categories. Identifying the correct category before attempting a fix prevents wasted effort on solutions that do not apply to the specific pattern.
- Access order mismatch. Two transactions update the same tables in different sequences (A updates Orders then OrderLines; B updates OrderLines then Orders). Run concurrently, each holds a lock the other needs. This is the most common pattern and the most straightforward to fix.
- Schema lock contention. A DDL operation (ALTER TABLE, CREATE INDEX, DROP INDEX) requires a Schema Modification (Sch-M) lock, incompatible with the Schema Stability (Sch-S) locks held by concurrent SELECT queries. This commonly occurs when index maintenance runs during active query workloads.
- Lock escalation. SQL Server escalates many row-level locks to a table-level lock once a session accumulates more than ~5,000 row locks. If another session holds locks anywhere in that table, the escalation attempt creates a deadlock.
- Key-range locks. Under SERIALIZABLE isolation, range scans acquire key-range locks to prevent phantom reads. Two sessions scanning overlapping ranges can deadlock when their ranges intersect.
- Hotspot contention. Many concurrent sessions updating the same row or page, such as a sequence counter or audit table, create high lock contention that can escalate to deadlocks.
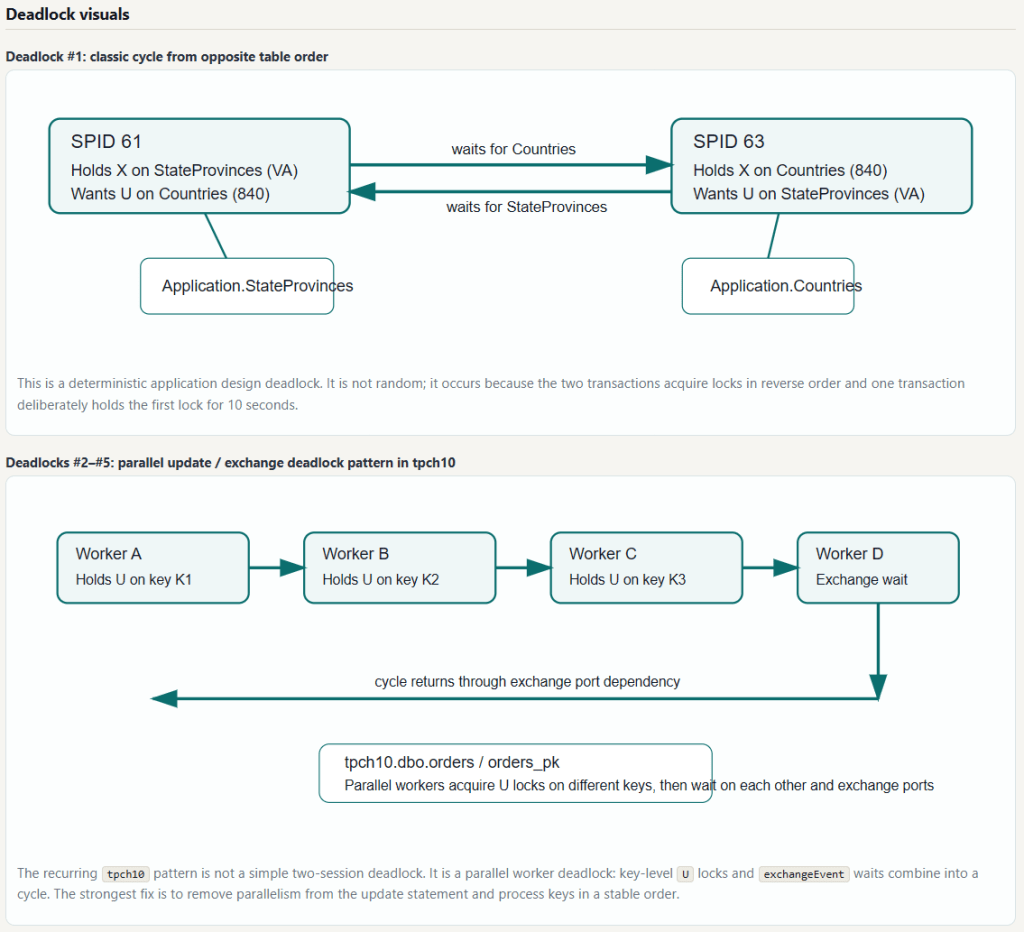
This list is not comprehensive. Deadlock #1 in the screenshot below illustrates an access order mismatch. But deadlocks #2-#5 are a parallel worker exchange deadlock, which happens when workers each grab U locks on different keys and then need to pass rows through exchange ports. They can end up waiting on each other’s buffers. The exchange port wait becomes part of the deadlock cycle.
How to Fix SQL Server Deadlocks
The fixes below are ordered by impact and applicability. Most deadlock scenarios are resolved by one or two of these changes. Start with the fix that matches the root-cause category you identified from the deadlock graph.
Enable Read Committed Snapshot Isolation (RCSI)
RCSI changes how SQL Server handles reads. Instead of acquiring shared locks on rows, readers use a row version stored in tempdb, so reads proceed without blocking writers and writers proceed without blocking readers. This eliminates deadlocks caused by reader-writer conflicts, including schema lock contention between SELECT queries and DDL operations.
RCSI is a database-level setting. Enable it during a maintenance window, because WITH ROLLBACK IMMEDIATE terminates any active connections to the database:
-- Enable snapshot isolation support firstALTER DATABASE [YourDatabase] SET ALLOW_SNAPSHOT_ISOLATION ON;GO-- Enable RCSI (requires brief exclusive database access)ALTER DATABASE [YourDatabase] SET READ_COMMITTED_SNAPSHOT ON WITH ROLLBACK IMMEDIATE;GO-- Verify the settingSELECT name, is_read_committed_snapshot_onFROM sys.databasesWHERE name = 'YourDatabase';
After enabling RCSI, monitor tempdb usage. The version store grows under write-heavy workloads, and a 10–20% increase in tempdb utilization is typical for mixed OLTP. RCSI does not fix write-write deadlocks caused by access order mismatches.
Enforce Consistent Table Access Order
When two procedures or code paths update the same set of tables, they must always access those tables in the same order. If Procedure A updates the parent table first then the child table, Procedure B must follow the same sequence; reversing it creates the conditions for a deadlock whenever both run concurrently.
The standard approach is to update parent tables before child tables, which aligns with foreign key relationships and is the most intuitive ordering to document and maintain. Add a comment in each procedure stating the access order and why, so future developers do not inadvertently reverse it.
-- Correct pattern: always update parent (Orders) before child (OrderLines)BEGIN TRANSACTION; UPDATE Sales.Orders SET Comments = @Comments WHERE OrderID = @OrderID; UPDATE Sales.OrderLines SET Description = @Description WHERE OrderID = @OrderID;COMMIT TRANSACTION;
Shorten Transaction Scope
The longer a transaction holds locks, the higher the probability another session needs the same resource during that window. Two habits cause most unnecessary transaction length: doing work outside the critical update path inside the transaction boundary, and calling user interfaces or external services from within a transaction.
Move preparatory work (lookups, calculations, validation) before BEGIN TRANSACTION, and non-critical post-processing (logging, notifications) after COMMIT. The transaction itself should contain only the data modifications that must be atomic.
-- Pattern to avoid: work inside the transaction extends lock durationBEGIN TRAN; EXEC dbo.usp_ValidateOrder @OrderID; -- locks held during validation UPDATE Sales.Orders SET Status = 'Approved' WHERE OrderID = @OrderID; WAITFOR DELAY '00:00:02'; -- locks held during arbitrary waitCOMMIT;-- Correct pattern: transaction contains only the essential updateEXEC dbo.usp_ValidateOrder @OrderID; -- validation before transactionBEGIN TRAN; UPDATE Sales.Orders SET Status = 'Approved' WHERE OrderID = @OrderID;COMMIT;
Add Targeted Indexes to Reduce Lock Footprint
A query that scans a table acquires many more row locks than a query that seeks an index. Reducing the rows a transaction touches directly reduces its lock footprint and the chance of conflicting with another session. For deadlocks involving range scans or large reads, add a nonclustered index that converts scans to seeks.
Review the deadlock graph for table scans on the contested tables, then create covering indexes for the queries involved. The SQL Server Index Optimization guide covers the full process for identifying and creating the right indexes.
Implement Application-Side Retry Logic
Even after addressing the root cause, transient deadlocks can still occur during high concurrency. Applications should catch error 1205 and retry the failed transaction with an exponential backoff, so deadlocks don’t surface as failures to end users while permanent fixes are validated.
The retry pattern at the T-SQL level looks like this:
CREATE OR ALTER PROCEDURE dbo.usp_UpdateWithRetry @OrderID INT, @MaxRetries INT = 3ASBEGIN SET NOCOUNT ON; DECLARE @Attempt INT = 0; WHILE @Attempt < @MaxRetries BEGIN BEGIN TRY BEGIN TRANSACTION; UPDATE Sales.Orders SET Status = 'Processed' WHERE OrderID = @OrderID; COMMIT TRANSACTION; RETURN; -- success, exit the loop END TRY BEGIN CATCH IF @@TRANCOUNT > 0 ROLLBACK TRANSACTION; IF ERROR_NUMBER() = 1205 -- deadlock victim BEGIN SET @Attempt += 1; WAITFOR DELAY '00:00:00.1'; -- 100ms backoff END ELSE THROW; -- re-raise non-deadlock errors END CATCH END THROW 50001, 'Max deadlock retries exceeded.', 1;END
Monitoring and Alerting
Fixes that look effective in testing sometimes mask contention that recurs under load. Persistent monitoring gives an early warning before deadlock frequency reaches the level where users notice failures.
Create a deadlock history table that your Extended Events session populates, then build a SQL Agent alert that fires when deadlocks exceed a threshold within a rolling window:
-- Table to store deadlock historyCREATE TABLE dbo.DeadlockHistory ( DeadlockID INT IDENTITY(1,1) PRIMARY KEY, CaptureTime DATETIME2 DEFAULT SYSDATETIME(), DatabaseName NVARCHAR(128), DeadlockGraph XML NOT NULL);CREATE INDEX IX_DeadlockHistory_CaptureTime ON dbo.DeadlockHistory (CaptureTime DESC);
Query the history table regularly to find the top offending queries and tables. A query appearing in multiple deadlock graphs over a short period is a reliable signal that a structural fix is needed rather than a retry-only approach. Three metrics worth tracking:
- Deadlock frequency per hour, segmented by database. A sudden spike indicates a deployment or schema change introduced a new contention pattern.
- Top offending queries by appearance count in deadlock graphs — the highest-priority candidates for code-level fixes.
- Deadlock victim rate by application. If one application is disproportionately the victim, its transaction design is a likely contributor.
Fix Deadlocks Faster with AI SQL Tuner Studio
Working through deadlock graphs, mapping object IDs to table names, cross-referencing lock types, and choosing the right fix from several options is time-intensive. AI SQL Tuner Studio‘s Fix Deadlocks goal automates the whole workflow and returns a prioritized, actionable HTML report in minutes.
How the Fix Deadlocks goal works
- Collects the deadlock graph(s). Reads recent deadlock XML from the platform’s supported source — the
system_healthExtended Events file target on on-premises SQL Server (sys.fn_xe_file_target_read_file), or thesystem_healthring buffer on Azure SQL Managed Instance (sys.dm_xe_session_targets). If no deadlocks are found, it generates an informational report directly and does not call the AI. - Collects RCSI status. Checks
is_read_committed_snapshot_onfor the current database and includes it in the data sent to the AI. - Asks the AI to review the deadlock XML — victim selection, each process/session, and the resources (keys/pages/objects) involved.
- Extracts likely objects and code involved (tables, indexes, constraints), using
inputbufstatement text where present to call out relevant statements and procedures. - Provides a prioritized next-step plan — concrete recommendations plus a shortlist of objects to analyze next.
Which SQL Server platforms support deadlock analysis?
- On-premises SQL Server — Supported (reads deadlocks from the
system_healthExtended Events file target). - Azure SQL Managed Instance — Supported (reads from the
system_healthring buffer). - Azure SQL Database — Not supported (no access to
system_healthdeadlock graphs). The tool returns recommended alternatives. - Microsoft Fabric SQL Database — Not supported (treated like Azure SQL Database for deadlock extraction). The tool returns recommended alternatives.
On an unsupported platform, AI SQL Tuner Studio returns specific guidance and alternatives such as Index Tuning, Code Review, or Azure Portal’s Query Performance Insight.
How to run it
- Select a connection from the Connections list (or create one).
- Choose Fix Deadlocks from the tuning goal dropdown.
- Set the number of deadlocks to analyze (1–20, default 5).
- Database is optional — if unspecified, it defaults to
master. - Optionally set Reasoning effort (Low, Medium, or High), then click Run. The HTML report appears in the Report panel and can be saved or exported.
Minimum permission: VIEW SERVER STATE (to read the Extended Events file target on-premises or the ring-buffer DMVs on Azure SQL MI), plus read access to sys.databases for the RCSI check (granted to public by default). For a least-privileged login, see Least Privileged Account Creation.
Sample output
Example output from a real analysis against the WideWorldImporters and TPC-H databases is shown below. The tool identified two distinct deadlock patterns and produced six prioritized recommendations, including expected impact and confidence level for each one.
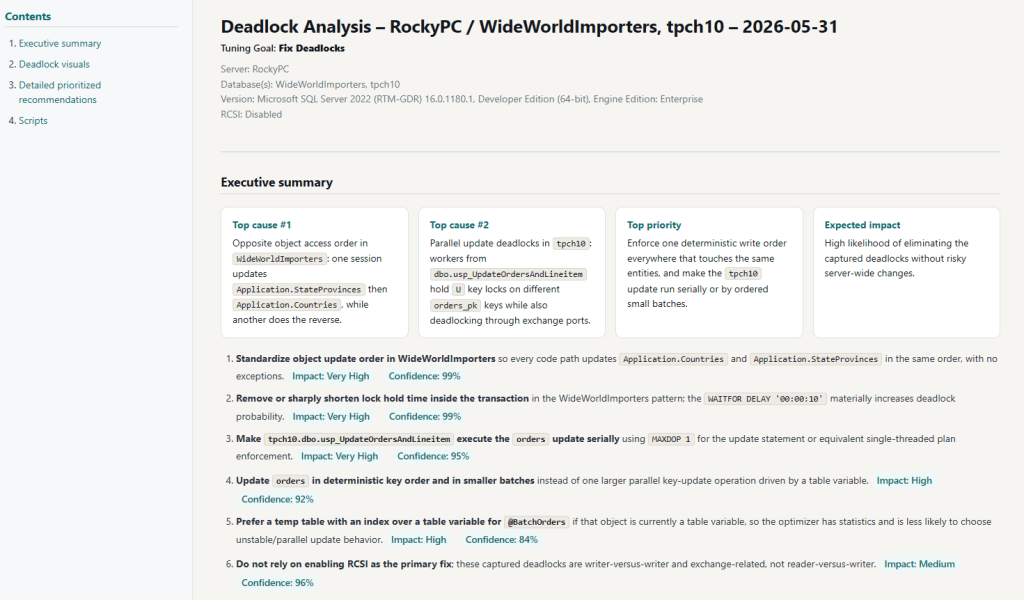
- CRITICAL: Two independent deadlock families identified — WideWorldImporters access‑order deadlocks and tpch10 parallel‑update/exchange deadlocks.
- CRITICAL: Opposite update order between Application.StateProvinces and Application.Countries is producing deterministic writer‑writer deadlocks.
- CRITICAL: Parallel workers in tpch10.dbo.usp_UpdateOrdersAndLineitem are deadlocking through U‑locks on different orders_pk keys combined with exchange port waits.
- HIGH: Excessive lock hold time in WideWorldImporters (WAITFOR inside the transaction) materially increases deadlock probability.
- HIGH: Unstable parallel update plans in tpch10 caused by table‑variable–driven batching and lack of statistics.
Top prioritized actions from that run: enforce a single deterministic write order across all WideWorldImporters code paths; remove artificial lock hold time; force the tpch10 orders update to run serially (MAXDOP 1); update orders in stable key order and smaller batches; and replace the table variable with an indexed temp table to give the optimizer statistics and reduce parallel deadlock risk.
See a complete sample deadlock report or browse all sample reports.
Supported AI models
All editions include OpenAI GPT-5.4 and Anthropic Claude Sonnet 4.6. The Corporate edition adds Anthropic Claude Opus 4.6, 4.7, and 4.8 for deeper reasoning on complex, multi-database deadlock patterns.
Editions and platforms
AI SQL Tuner Studio runs on Windows against SQL Server (on-prem and IaaS), Azure SQL Database, Azure SQL Managed Instance, and Microsoft Fabric SQL Database. The Free edition covers SQL Server Developer Edition at no cost; paid editions include a 14-day trial and a 30-day money-back guarantee. Download the free edition or compare editions and pricing. (Note: the Fix Deadlocks goal specifically requires on-premises SQL Server or Azure SQL MI, as noted above.)
Frequently Asked Questions
What causes SQL Server deadlocks?
SQL Server deadlocks occur when two or more sessions hold locks that each other needs, and neither can proceed. The most common causes are transactions accessing the same tables in different orders, long-running transactions that hold locks while doing unrelated work, range scans under SERIALIZABLE isolation, and DDL operations running concurrently with active SELECT queries. SQL Server selects a deadlock victim, rolls back its transaction, and returns error 1205.
What is the difference between a deadlock and blocking in SQL Server?
Blocking occurs when one session holds a lock another session is waiting for; the waiting session proceeds once the lock is released. A deadlock is a circular blocking situation where Session A waits for Session B and Session B waits for Session A simultaneously — neither can proceed on its own. SQL Server detects the cycle and terminates one session to break it. Blocking resolves itself; deadlocks require SQL Server intervention.
How do I read a SQL Server deadlock graph?
A deadlock graph shows each session as an oval and each contested resource as a rectangle, with arrows for lock requests and grants; the victim session has an X through it. To analyze it: identify the two sessions and their SQL statements, note the object and index IDs of the contested resource, map those IDs to table and index names using sys.partitions and sys.indexes, then classify the root cause from the lock types involved (shared vs. exclusive, Sch-S vs. Sch-M).
Does enabling Read Committed Snapshot Isolation fix all SQL Server deadlocks?
No. RCSI eliminates deadlocks caused by readers conflicting with writers by using row versioning instead of shared locks for reads, which resolves schema lock contention between SELECT queries and DDL operations. It does not fix deadlocks caused by two writers accessing the same rows in different orders, or by application-level transaction design issues. RCSI also adds version-store overhead in tempdb, so test its impact before enabling in production.
Which SQL Server platforms support deadlock analysis in AI SQL Tuner Studio?
The Fix Deadlocks goal is supported on on-premises SQL Server (reads from the system_health Extended Events file target) and Azure SQL Managed Instance (reads from the system_health ring buffer). It is not supported on Azure SQL Database or Microsoft Fabric SQL Database, because those platforms do not expose the system_health deadlock graphs; the tool returns recommended alternatives instead.
What permissions are required to run Fix Deadlocks?
Fix Deadlocks requires VIEW SERVER STATE to read sys.fn_xe_file_target_read_file (on-premises) or sys.dm_xe_session_targets and sys.dm_xe_sessions (Azure SQL MI ring buffer). Read access to sys.databases for the RCSI status check is granted to public by default.
What happens if no deadlocks are found?
When no deadlocks are found in the system_health session, the tool generates an informational HTML report directly without calling the AI, saving time and cost. The report confirms no deadlock events were recorded and suggests running Index Tuning, Code Review, or Server Health for further analysis.
How many deadlocks can AI SQL Tuner Studio analyze at once?
Fix Deadlocks can analyze between 1 and 20 recent deadlock graphs in a single run; the default is 5. Configure this with the “Deadlocks to analyze” option before clicking Run.
Can AI automate SQL Server deadlock analysis?
Yes. AI SQL Tuner Studio automates deadlock analysis by capturing recent deadlock graphs, mapping resource identifiers to schema objects, classifying root causes, and generating prioritized fixes with ready-to-run T-SQL scripts. It distinguishes lock-ordering issues, RCSI candidates, schema lock contention, and index-coverage problems. A DBA reviews and approves recommendations before implementing them, reducing analysis time from hours to minutes for complex multi-deadlock scenarios.
Related Resources
- SQL Server Deadlocks Guide (Microsoft Docs)
- Extended Events system_health Session (Microsoft Docs)
- SQL Server Index Optimization
- SQL Server Performance Tuning Guide
- AI SQL Tuner Studio User Guide
Fix SQL Server Deadlocks Today
Most SQL Server deadlocks come from a small set of well-understood patterns: access order mismatches, RCSI disabled, schema lock contention from DDL, or transactions holding locks longer than necessary. Identifying which pattern applies means reading the deadlock graph and cross-referencing the involved sessions and resources. This is work that AI SQL Tuner Studio automates, classifying your deadlocks and producing a prioritized fix plan with implementation scripts in minutes. Download the free edition for SQL Server Developer Edition, or explore paid plans, all backed by a 30-day money-back guarantee.