AI SQL Tuner Studio’s jump from 1.0.48 to 2.0 marks a round of work focused on what the tool actually reads from your SQL Server, how it presents the findings, and how it warns you about risks you might not be tracking yourself. If you run older SQL Server builds, manage heaps you have forgotten about, or just want reports that look sharp on any screen, this release is worth the upgrade. Here is what changed.
See it in action: View a sample Locking and Blocking Analysis report | View a sample Deadlock Analysis report
Table of Contents
Reports now lean on SVG graphics
Earlier reports had no images, or basic text-based visualizations. We changed the AI prompts to prefer SVG diagrams and visual aids instead.
The practical result: diagrams, dependency graphs, and other visual content in your HTML reports are now scalable vector graphics. They stay crisp at any zoom level, render cleanly in print and PDF export, and look more professional when you hand a report to a manager or a client. The system prompts also include explicit guidance on when a structured diagram adds value to the analysis, so you get visuals where they help and plain text where they do not.

Server Health flags out-of-support SQL versions and missing patches
Are you still running a little older version of SQL Server, or haven’t quite kept up with applying patches? You are not alone. 🙂
Version lifecycle status
Server Health now checks your SQL Server version against Microsoft’s published mainstream and extended support dates, covering SQL Server 2014 through 2025. It returns a simple traffic-light status:
- Green: More than a year before mainstream support ends.
- Yellow: Within a year of mainstream support ending, or in extended support with more than a year left.
- Red: In extended support with a year or less remaining, or already past the extended support end date.
If you are running an instance that fell off support last year and nobody flagged it, this is how you find out.
Patch currency status
Alongside version lifecycle, Server Health now grades how current your cumulative update is. It pulls patch data dynamically from Microsoft Learn, with a hardcoded fallback if that data is not reachable:
- Green: On a CU released three months ago or less.
- Yellow: On a CU released three to twelve months ago.
- Red: On a CU released more than twelve months ago.
Both checks feed their results, with detailed messages, straight into the AI so the overall health report explains what the status means and what to do about it. These checks are skipped automatically for Azure SQL Database, Azure SQL Managed Instance, and Microsoft Fabric SQL Database, since Microsoft manages patching on those platforms.

See the full sample Server Health report
Index Tuning now analyzes heaps
Heaps, meaning tables with no clustered index, are easy to forget and a common source of quiet performance drag, especially once forwarded records pile up. The quote below from the “When not to use a heap” section of Microsoft Learn heap page explains it further.
If you update a record and the update uses more space in the data pages than they are currently using, the record has to be moved to a data page that has enough free space. This creates a forwarded record pointing to the new location of the data, and forwarding pointer has to be written in the page that held that data previously, to indicate the new physical location. This introduces fragmentation in the heap. When Database Engine scans a heap, it follows these pointers. This action limits read-ahead performance, and can incur additional I/O which reduces scan performance.
Index Tuning now collects heap analysis as part of its run, reporting row totals, reserved size, forwarded records, and fragmentation for the heaps in scope.
Claude Opus 4.8 support for Corporate edition
The MODEL dropdown now includes Claude Opus 4.8 (Anthropic, Corporate). If you hold a Corporate license, you can run your analysis with the newest Opus model with no extra setup.
A deeper, more reliable set of collectors
Most of the 2.0 work happened under the hood, in the collectors that gather data before any AI ever sees it. The headline items:
Six new Server Health memory and lock diagnostics. Server Health now ships seventeen collectors total, including six new ones aimed at memory and lock pressure:
- Memory clerk breakdown, which highlights
OBJECTSTORE_LOCK_MANAGERto surface lock-manager memory growth. - Lock manager cache size, a scalar reading in MB with threshold guidance that alerts when it exceeds roughly 20 to 25 percent of total SQL memory.
- RESOURCE_SEMAPHORE waiters, showing sessions stuck waiting on memory grants with requested versus granted memory.
- Top memory grants, surfacing the largest active grants with SQL text so you can spot a runaway plan.
- Buffer pool distribution per database, where a low buffer pool combined with high lock-manager memory gets flagged.
- Lock counts by session, grouping current lock holders so you can see which session is holding too much.
The Server Health prompt was updated to reason about these patterns and recommend emergency remediation, such as DBCC FREESYSTEMCACHE, when the evidence supports it.
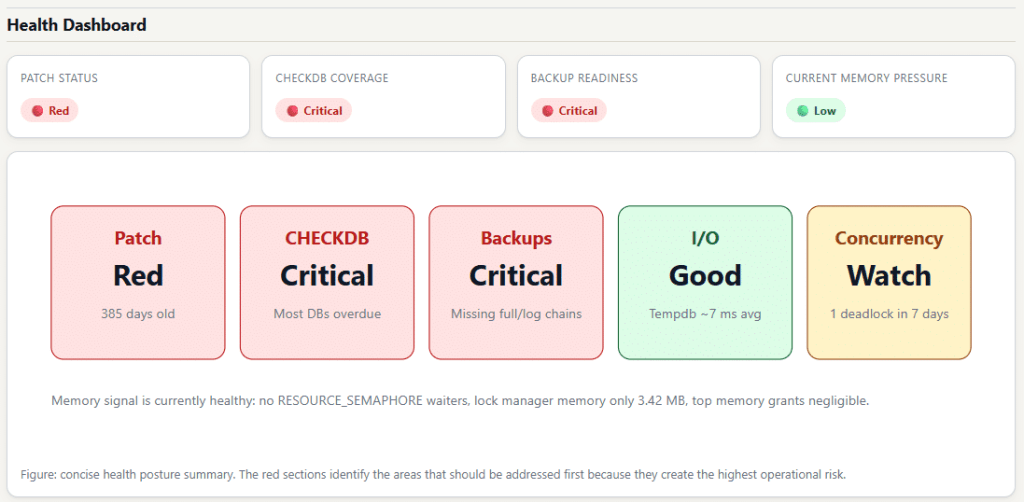
A big thank you to Andreas Schubert for his LinkedIn post regarding the issues he encountered on SQL Server 2019, which was the inspiration for these additional checks.
SQL Server 2025 support. All collectors now recognize and run against SQL Server 2025, which reports as major version 17 with compatibility level 170, alongside the existing support for 2014 through 2022.
Structured collector signals. Collectors now tag what they return as High Impact, Medium Impact, or diagnostic, so the AI knows what to prioritize and what is supporting context. That produces tighter, better-ordered recommendations.
Upgrading
AI SQL Tuner still runs entirely on your machine, with no telemetry and no business data leaving the box. Everything in 2.0.1 is backward compatible: SQL Server 2025 recognition, the new memory diagnostics, lifecycle and patch checks, and Query Store fallback all activate on their own with no configuration. Grab 2.0.1 from aisqltuner.com or use Check for Updates inside Studio.